Maybe you’ve heard the rules of program optimization.
- Don’t optimize
- Don’t optimize yet (experts only)
If everyone followed the rules, then nobody would optimize and there wouldn’t be any experts! Looks like some of you are guilty. Obviously, the idea is that we should avoid unnecessary optimization, not that we shouldn’t optimize at all. But when do we start thinking about performance? The original rule, which dates back to the book Principles of Program Design, gives a clue.
“Don’t do it yet — that is, not until you have a perfectly clear and unoptimized solution” Michael Jackson, 1975
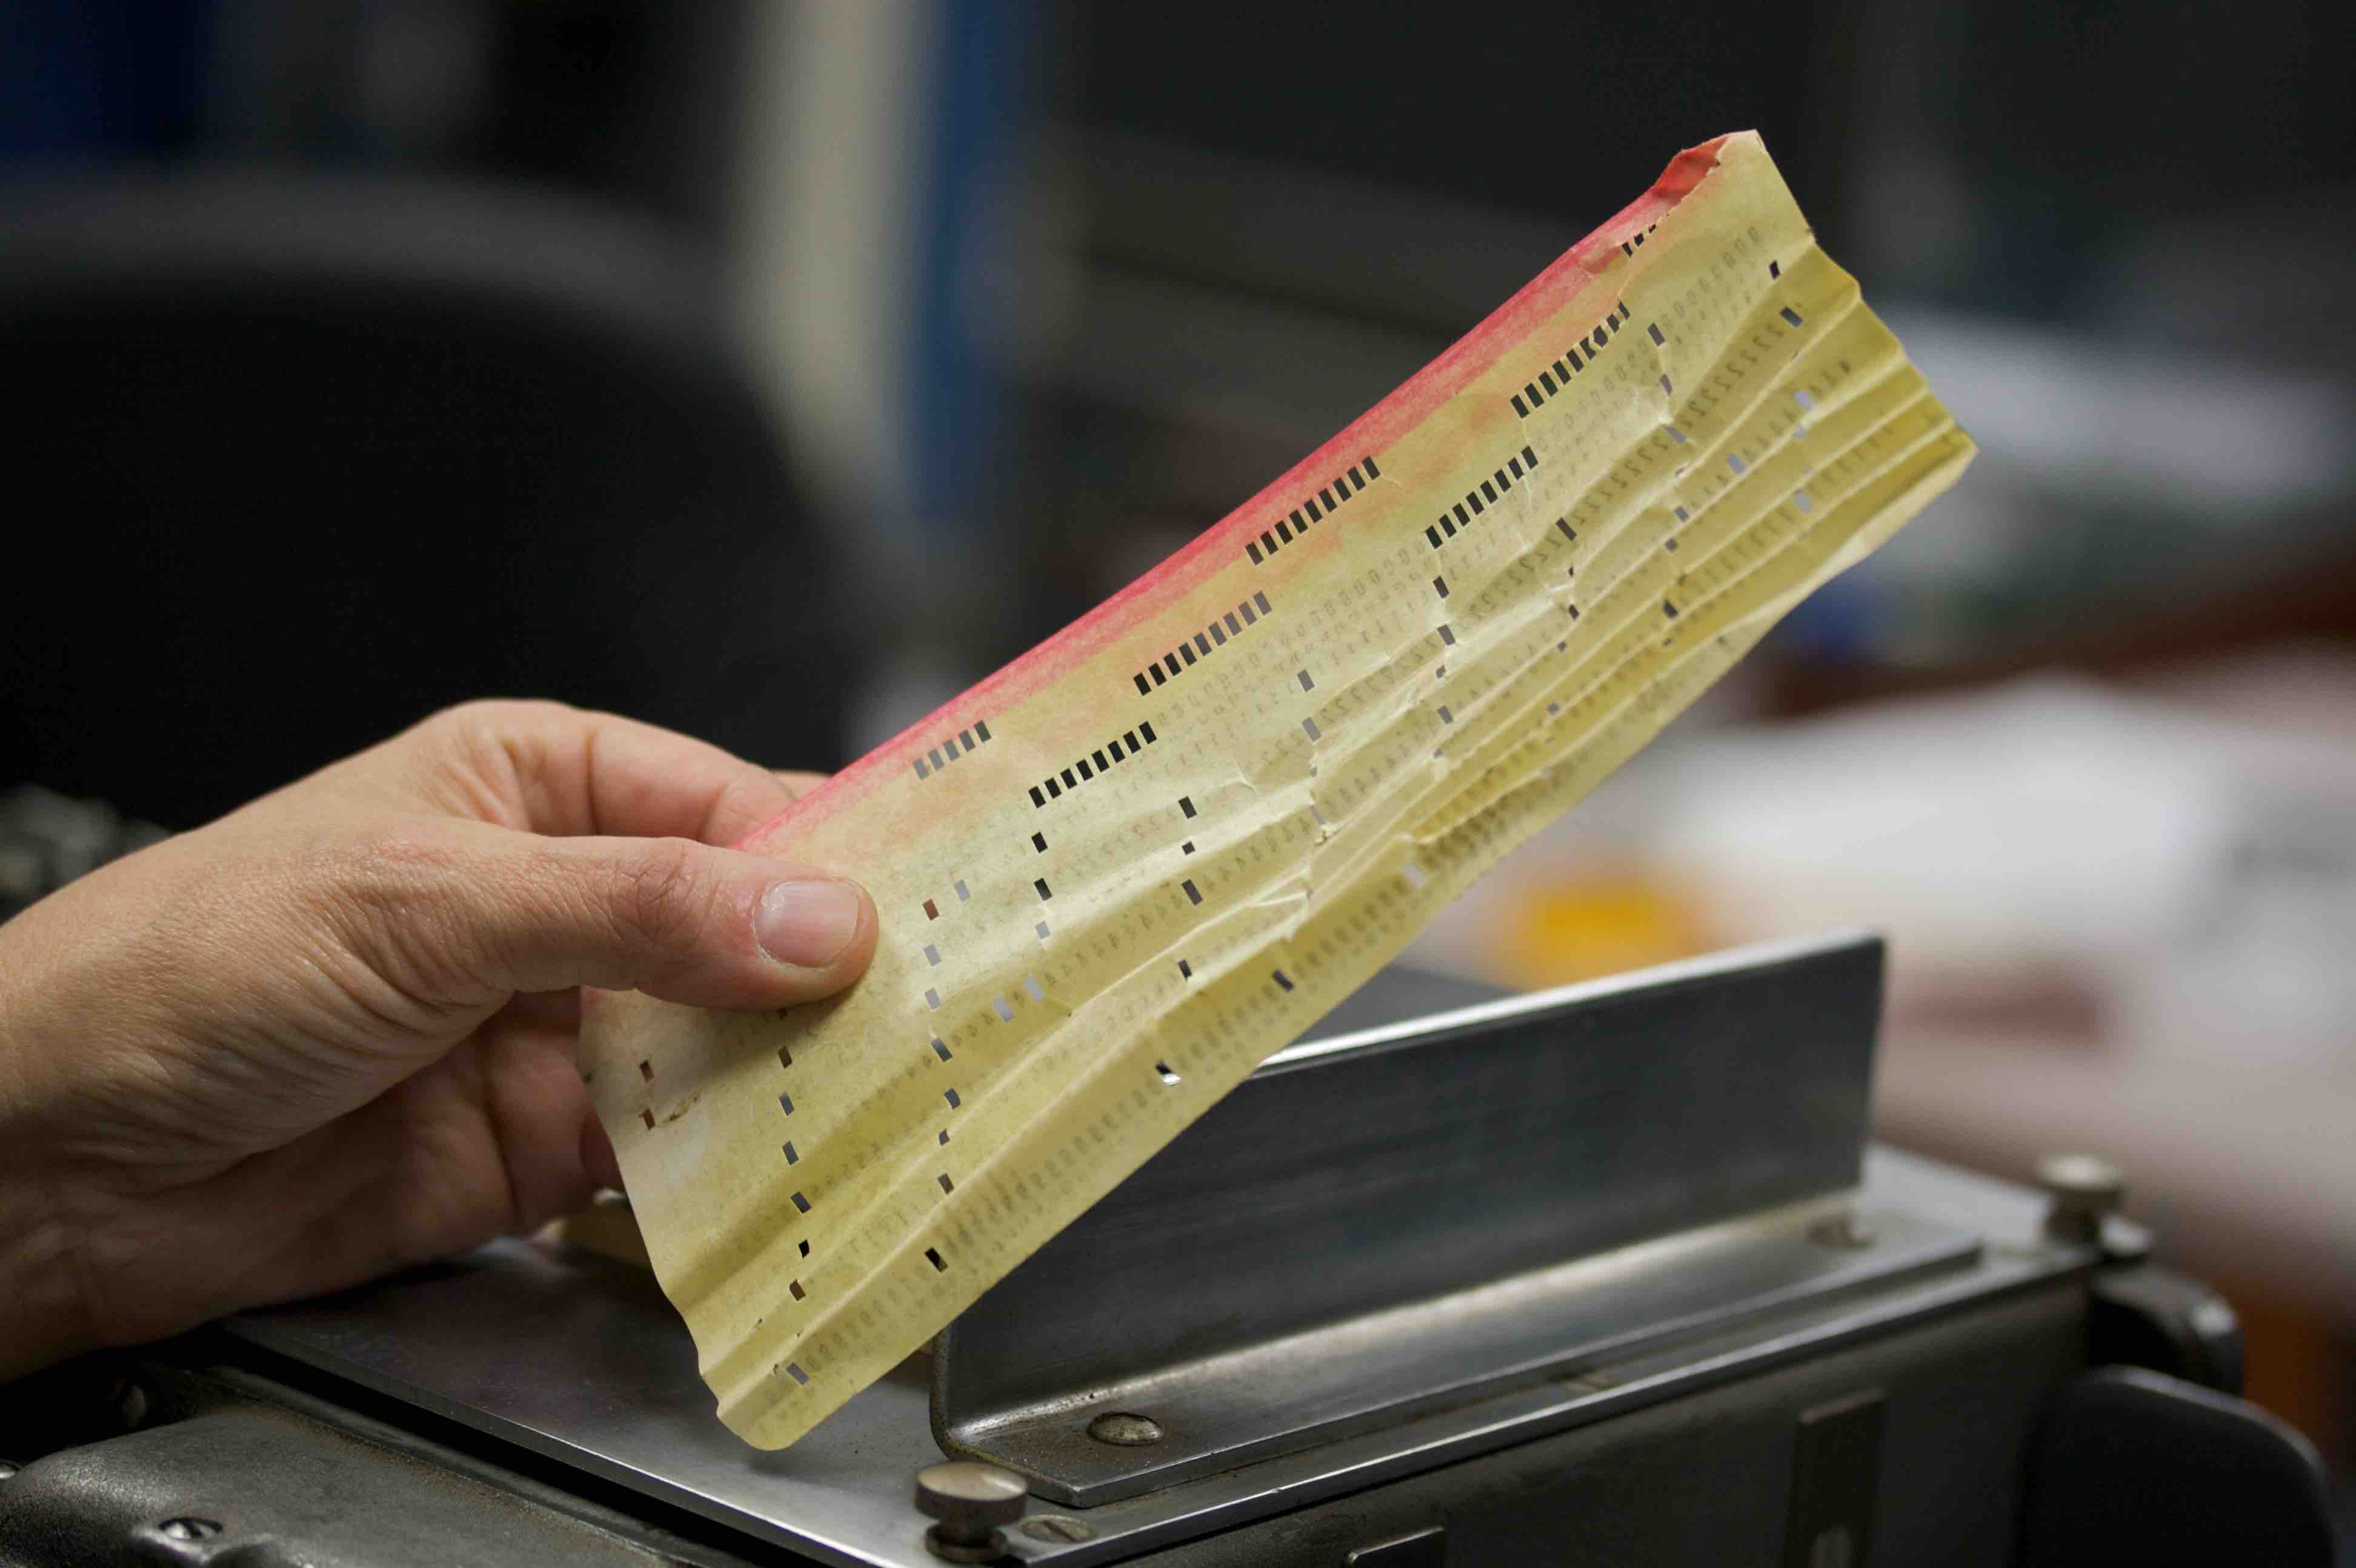
The second half of the quote was dropped by future books, but maybe it shouldn’t have been - it’s good advice that’s still relevant 45 years later. Jackson’s foresight is amazing when you realize that computers in 1975 still used punch cards. Since punch cards don’t have a backspace, the term “perfectly clear solution” takes on a whole new meaning. These days, a punching error at work means criminal charges, not debugging, and the punch cards are in the computer history museum.
Our first priority is still to produce correct and maintainable code, but today we have powerful tools to measure performance and run tests. We can iterate faster and optimize earlier - but only with the right setup. Disclaimer: I work on computationally expensive problems in machine learning. I think this optimization checklist contains some good general guidelines, but I am biased by my environment.
Do you need to optimize your code?
Sometimes, you can avoid optimization altogether by changing the design, using better algorithms, or modifying the production runtime.
-
Is there a performance problem? If you have no valid reason to optimize, don’t do it.
-
Is the problem reproducible? You shouldn’t optimize until you have a benchmark that reproduces the problem. Pay special attention to randomized algorithms and machine learning code. Uncommon (but severe) performance problems can be hidden by randomness. The problem might also be something external to your code, such as the system configuration, hardware, or dependency version.
-
Are the requirements stable? Don’t optimize if the code might be replaced in a week.
-
Are you using the right algorithms? Make thoughtful choices for data structures and algorithms. Don’t make decisions based solely on theoretical complexity. Sometimes, “worse” complexity is much faster in practice, especially if you can throw a GPU at it or use a ridiculously optimized SAT solver. I would rather do \(O(N)\) bit operations than compute \(O(\log N)\) digits of \(\pi\).
-
Did you design for performance? You should think about performance at the architecture design phase. In demanding areas such as graphics and machine learning, we often design for performance from Day 1. Consider the type of hardware that will likely run your code. It is a good idea to flatten class hierarchies, minimize the number of abstractions, and make a plan for memory allocations.
Is your code ready to optimize?
-
Is the code correct? Fast wrong answers are still wrong.
-
Is the code maintainable? The code should be as simple as possible, but no more. Optimization usually makes code harder to maintain. Start with as little complexity as you can.
-
Do you have unnecessary dependencies? Before optimizing, examine your dependency list. Removing dependencies is a good way to pay off tech debt, but it can also speed up the code.
-
Do you have tests? You’ll need correctness tests to verify that the program is still correct after your optimizations. Re-run the tests every time you change the code.
-
Do you have a benchmark? To know whether you are actually making the code faster, you need to evaluate the code on a standard task before / after doing the optimization. It is best to automate the process of running the benchmark so that you can easily check code changes.
-
Is the benchmark realistic? The benchmark should run the program under the conditions and inputs that the program will encounter in production. If possible, use the exact inputs that cause the program to have bad performance. If the program might encounter different types of inputs, make sure each type is represented in your benchmark.
-
Does the code follow best practices? Each programming language has best practices that lead to good performance. For example, we avoid temporary local copies and pass objects by reference in C++ to avoid copying large data structures. Without following best practices, you might encounter uniformly slow code when you profile, where the true performance problems are hidden by hundreds of simple mistakes. These improvements are free in the sense that they usually don’t hurt maintainability.
Do you have the information you need?
-
Have you profiled? Use a profiler to identify bottlenecks - do not rely on intuition. Generate a flame graph or examine a random sample of stack traces. If you are optimizing a compiled language, you should profile a release build - debug builds can have much different performance characteristics. You should also profile the system on the production hardware, if possible. The closer the profiling setup to the deployment setup, the better.
-
Does the profiler measure the right thing? Your program might be wasting CPU cycles, but it might also be writing massive files, spending hours waiting for a DNS response, cache thrashing, or quivering in fear of Brendan Gregg. Since I work on algorithms and data structures, my code is usually (surprise!) CPU bound. But I have seen deep learning code that is bound by GPU memory and CPU-GPU communication, and I’ve written bioinformatics software that is bound by file IO. Network communication is a problem in web development and distributed computing, and electricity is a limiting factor for IoT. Use off-cpu analysis or just pause the program in a debugger to catch non-CPU problems.
-
Are you profiling the right workload? As you optimize, the program may become so fast that the profiler can no longer attach to the process when you run the benchmark. You will need to give the program more work, perhaps by calling the benchmark in a loop. This should be done carefully to make sure that the new workload is still representative of performance.
-
Does the profiler show hotspots? In well-written code, the profiler will show that the program spends most of its time in a few expensive locations, called “hotspots”. If the profiler does not show hotspots, you may need to rethink your design or programming practices to avoid uniformly slow code.
[Image Credit] Jeremy Bishop on Unsplash
[Image Credit] Taken at the Computer History Museum’s IBM 1401 restoration project. Released under the CC BY 2.0 license.